
EXHIBIT 99.3
Fiscal 2023 first quarter performance Financial results & company highlights February 14, 2023
Important Notifications* 2 * See slides 11 through 14 for additional details regarding Important Notifications. (a- see slide 12 herein for detail build ups of Adjusted EPS, Adjusted EBITDA (“AEBITDA”) and Free Cash Flow (“FCF”). CAUTION CONCERNING FORWARD-LOOKING STATEMENTS: This document contains "forward-looking statements" – that is, statements related to future events that by their nature address matters that are, to different degrees, uncertain. For details on the uncertainties that may cause our actual future results to be materially different than those expressed in our forward-looking statements, see our most recent annual report on Form 10-K, quarterly reports on Form 10-Q, and our most recent earnings investor presentations. We do not undertake to update our forward-looking statements. This document also includes certain forward-looking projected financial information that is based on current estimates and forecasts and financial goals, for which complete plans, projections or predictions have not yet been developed. Actual results could differ materially. NON-GAAP FINANCIAL MEASURES: In this document, we sometimes use information derived from consolidated financial data but not presented in our financial statements prepared in accordance with U.S. generally accepted accounting principles (GAAP). Certain of these data are considered “non-GAAP financial measures” under the U.S. Securities and Exchange Commission rules. These non-GAAP financial measures supplement our GAAP disclosures and should not be considered an alternative to the GAAP measure. The reasons we use these non-GAAP financial measures and the reconciliations to their most directly comparable GAAP financial measures are included in our earnings release and the appendix of this presentation and prior earnings presentations, as applicable. Amounts shown on subsequent pages may not add due to rounding and represent approximations, accordingly. GEE’s Investor Relations information may be found on our website at https://ir.geegroup.com and, as well as GEE Group’s Facebook page and Linked In accounts, contain a significant amount of information about GEE Group, including financial and other information for investors. GEE encourages investors to visit these websites from time to time, as information is updated and new information is posted.
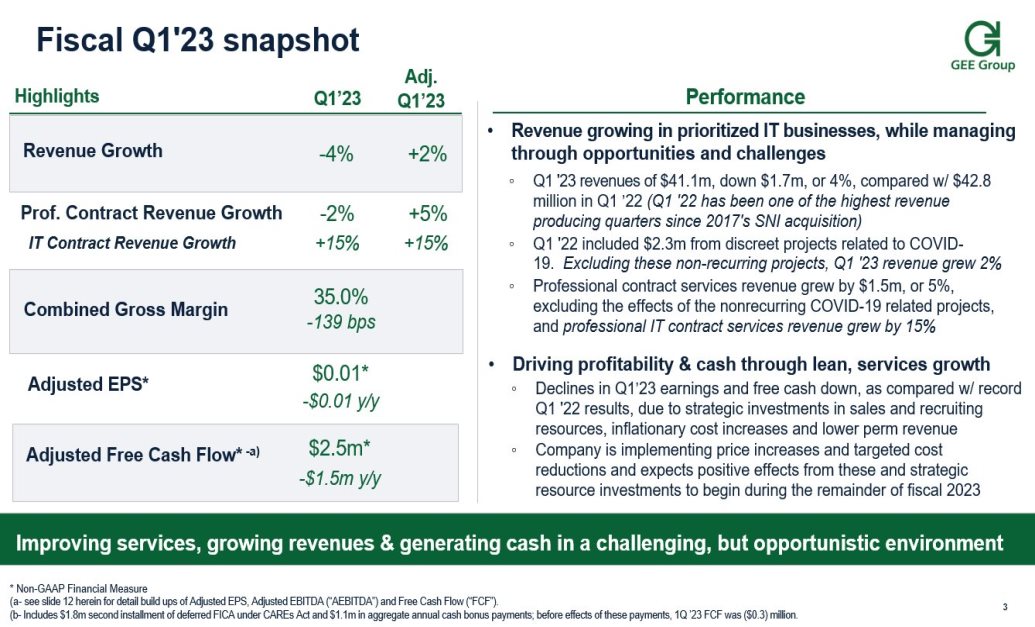
Fiscal Q1'23 snapshot 3 Improving services, growing revenues & generating cash in a challenging, but opportunistic environment Performance Revenue growing in prioritized IT businesses, while managing through opportunities and challenges Q1 '23 revenues of $41.1m, down $1.7m, or 4%, compared w/ $42.8 million in Q1 ’22 (Q1 '22 has been one of the highest revenue producing quarters since 2017's SNI acquisition) Q1 '22 included $2.3m from discreet projects related to COVID-19. Excluding these non-recurring projects, Q1 '23 revenue grew 2% Professional contract services revenue grew by $1.5m, or 5%, excluding the effects of the nonrecurring COVID-19 related projects, and professional IT contract services revenue grew by 15% Driving profitability & cash through lean, services growth Declines in Q1’23 earnings and free cash down, as compared w/ record Q1 '22 results, due to strategic investments in sales and recruiting resources, inflationary cost increases and lower perm revenue Company is implementing price increases and targeted cost reductions and expects positive effects from these and strategic resource investments to begin during the remainder of fiscal 2023 Prof. Contract Revenue Growth Highlights +5% Combined Gross Margin Adjusted EPS* $0.01* -$0.01 y/y Adjusted Free Cash Flow* -a) $2.5m* -$1.5m y/y * Non-GAAP Financial Measure (a- see slide 13 herein for detail build ups of Adjusted EPS, Adjusted EBITDA (“AEBITDA”) and Free Cash Flow (“FCF”). (b- Includes $1.8m second installment of deferred FICA under CAREs Act and $1.1m in aggregate annual cash bonus payments; before effects of these payments, 1Q ’23 FCF was ($0.3) million. Revenue Growth +2% Q1’23 35.0% -139 bps Adj. Q1’23 IT Contract Revenue Growth -4% -2% +15% +15%
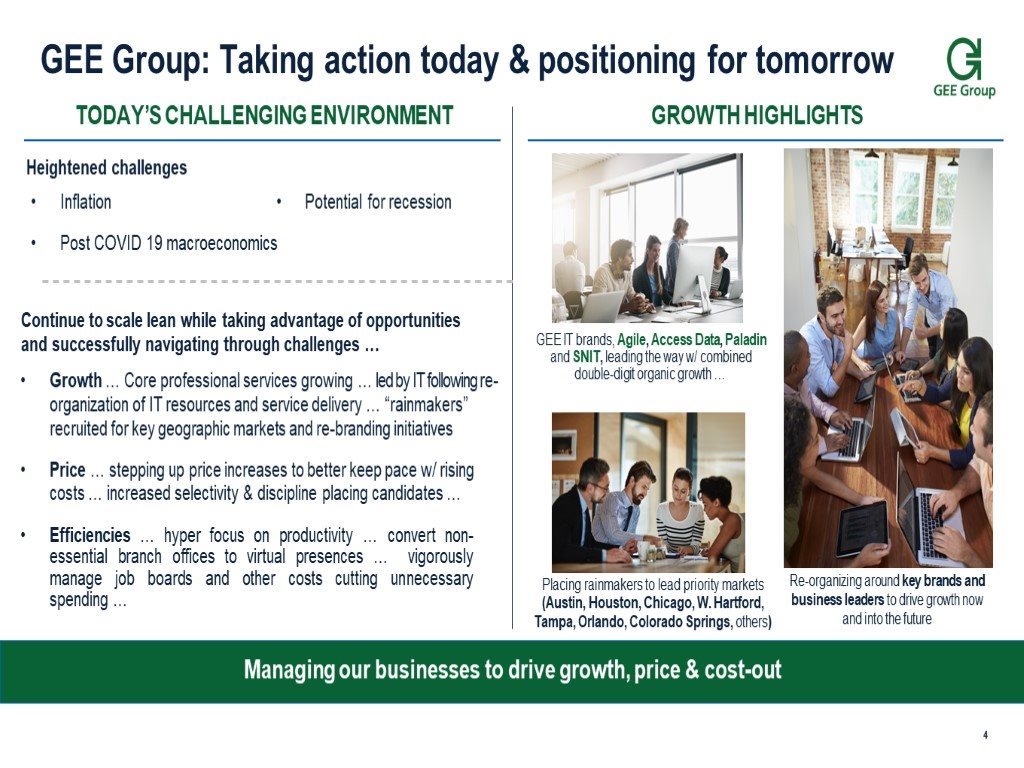
GEE Group: Taking action today & positioning for tomorrow 4 Continue to scale lean while taking advantage of opportunities and successfully navigating through challenges … Growth … Core professional services growing … led by IT following re-organization of IT resources and service delivery … “rainmakers” recruited for key geographic markets and re-branding initiatives Price … stepping up price increases to better keep pace w/ rising costs … increased selectivity & discipline placing candidates … Efficiencies … hyper focus on productivity … convert non-essential branch offices to virtual presences … vigorously manage job boards and other costs cutting unnecessary spending … GEE IT brands, Agile, Access Data, Paladin and SNIT, leading the way w/ combined double-digit organic growth … Re-organizing around key brands and business leaders to drive growth now and into the future FPO Managing our businesses to drive growth, price & cost-out TODAY’S CHALLENGING ENVIRONMENT GROWTH HIGHLIGHTS Heightened challenges Inflation • Potential for recession Post COVID 19 macroeconomics Placing rainmakers to lead priority markets (Austin, Houston, Chicago, W. Hartford, Tampa, Orlando, Colorado Springs, others)
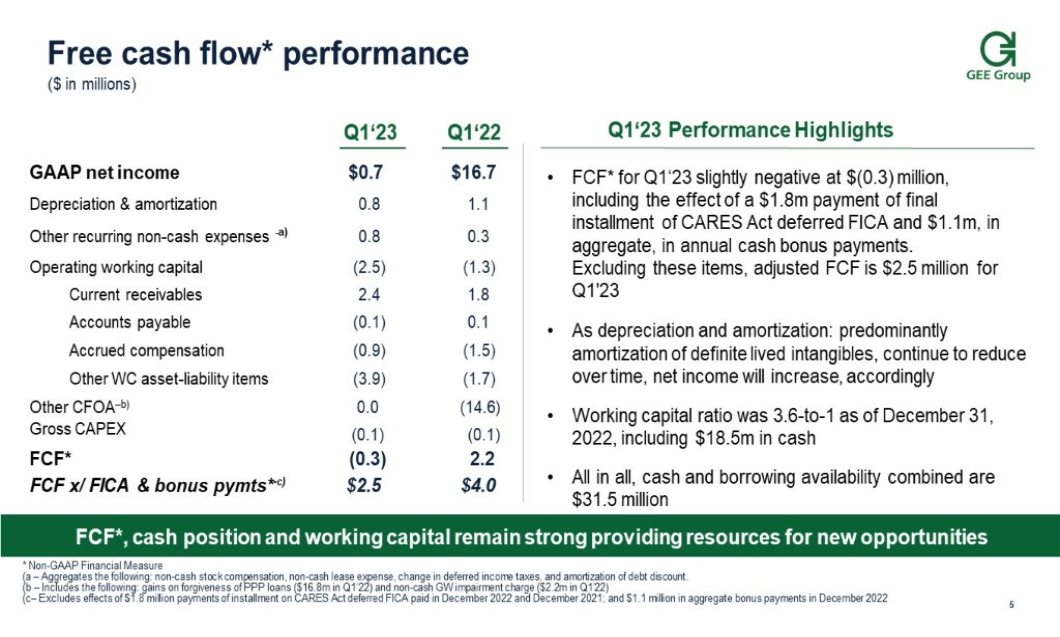
5 Free cash flow* performance ($ in millions) * Non-GAAP Financial Measure (a – Aggregates the following: non-cash stock compensation, non-cash lease expense, change in deferred income taxes, and amortization of debt discount. (b – Includes the following: gains on forgiveness of PPP loans ($16.8m in Q1‘22) and non-cash GW impairment charge ($2.2m in Q1’22) (c– Excludes effects of $1.8 million payments of installment on CARES Act deferred FICA paid in December 2022 and December 2021; and $1.1 million in aggregate bonus payments in December 2022 FCF*, cash position and working capital remain strong providing resources for new opportunities FCF* for Q1‘23 slightly negative at $(0.3) million, including the effect of a $1.8m payment of final installment of CARES Act deferred FICA and $1.1m, in aggregate, in annual cash bonus payments. Excluding these items, adjusted FCF is $2.5 million for Q1'23 As depreciation and amortization: predominantly amortization of definite lived intangibles, continue to reduce over time, net income will increase, accordingly Working capital ratio was 3.6-to-1 as of December 31, 2022, including $18.5m in cash All in all, cash and borrowing availability combined are $31.5 million Q1‘23 Q1‘22 Q1‘23 Performance Highlights
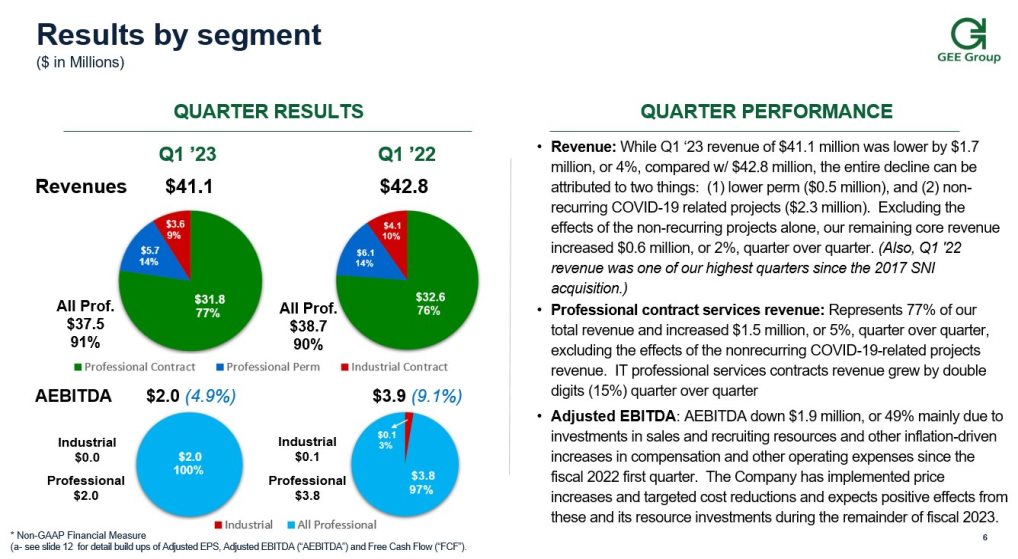
* Non-GAAP Financial Measure (a- see slide 13 for detail build ups of Adjusted EPS, Adjusted EBITDA (“AEBITDA”) and Free Cash Flow (“FCF”). QUARTER RESULTS QUARTER PERFORMANCE Results by segment ($ in Millions) Q1 ’23 Revenues $41.1 $42.8 AEBITDA $2.0 (4.9%) $3.9 (9.1%) All Prof. $37.5 91% Professional $2.0 Professional $3.8 Revenue: While Q1 ‘23 revenue of $41.1 million was lower by $1.7 million, or 4%, compared w/ $42.8 million, the entire decline can be attributed to two things: (1) lower perm ($0.5 million), and (2) non-recurring COVID-19 related projects ($2.3 million). Excluding the effects of the non-recurring projects alone, our remaining core revenue increased $0.6 million, or 2%, quarter over quarter. (Also, Q1 '22 revenue was one of our highest quarters since the 2017 SNI acquisition.) Professional contract services revenue: Represents 77% of our total revenue and increased $1.5 million, or 5%, quarter over quarter, excluding the effects of the nonrecurring COVID-19-related projects revenue. IT professional services contracts revenue grew by double digits (15%) quarter over quarter Adjusted EBITDA: AEBITDA down $1.9 million, or 49% mainly due to investments in sales and recruiting resources and other inflation-driven increases in compensation and other operating expenses since the fiscal 2022 first quarter. The Company has implemented price increases and targeted cost reductions and expects positive effects from these and its resource investments during the remainder of fiscal 2023. Industrial $0.0 Industrial $0.1 6 Q1 ’22 All Prof. $38.7 90%
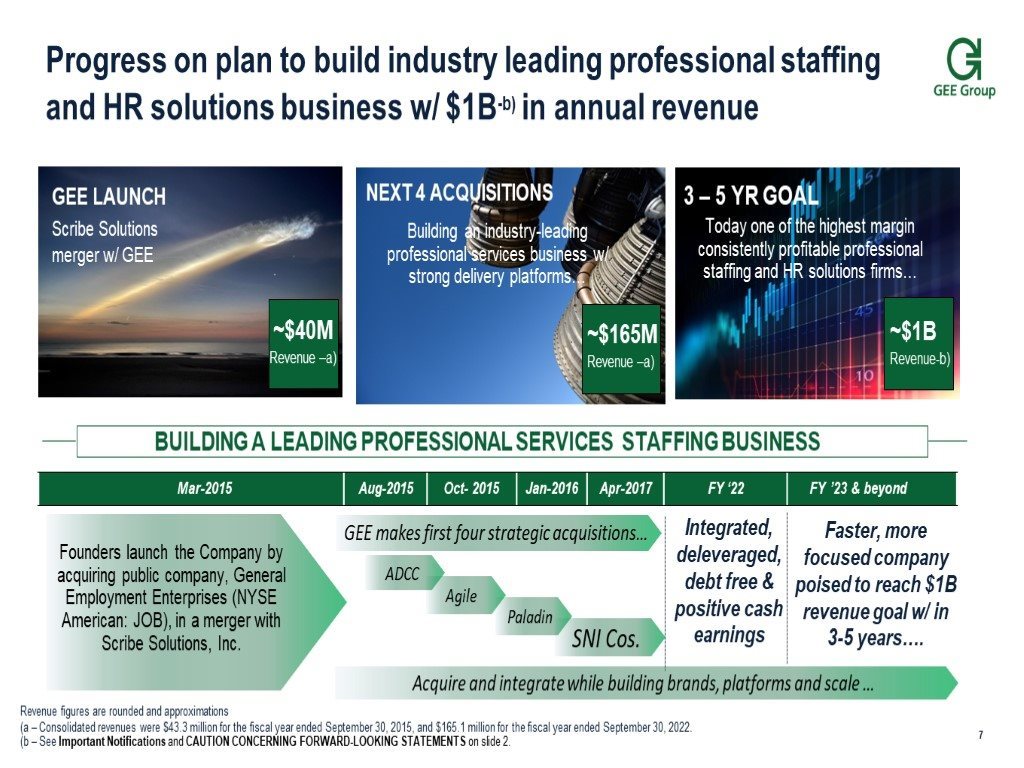
SNI Cos. Paladin Agile Progress on plan to build industry leading professional staffing and HR solutions business w/ $1B-b) in annual revenue 7 Revenue figures are rounded and approximations (a – Consolidated revenues were $43.3 million for the fiscal year ended September 30, 2015, and $165.1 million for the fiscal year ended September 30, 2022. (b – See Important Notifications and CAUTION CONCERNING FORWARD-LOOKING STATEMENTS on slide 2. Scribe Solutions merger w/ GEE BUILDING A LEADING PROFESSIONAL SERVICES STAFFING BUSINESS Faster, more focused company poised to reach $1B revenue goal w/ in 3-5 years…. GEE LAUNCH ~$40M Revenue –a) NEXT 4 ACQUISITIONS ~$165M Revenue –a) 3 – 5 YR GOAL ~$1B Revenue-b) Today one of the highest margin consistently profitable professional staffing and HR solutions firms… Building an industry-leading professional services business w/ strong delivery platforms… Founders launch the Company by acquiring public company, General Employment Enterprises (NYSE American: JOB), in a merger with Scribe Solutions, Inc. GEE makes first four strategic acquisitions… ADCC Acquire and integrate while building brands, platforms and scale … Integrated, deleveraged, debt free & positive cash earnings

CREATING VALUE TODAY & TOMORROW Recap … 8 Power: Collaborating with on decarbonization roadmap to lower emissions at Grain power plant in U.K. Precision health Energy transition BUILDING STAFFING AND HR SOLUTIONS THAT WORK GEE is growing in critical sectors ... w/ significant opportunities ahead in our businesses Aviation: Partnering with Boeing on hybrid electric test demonstration program Future of flight Improving services, order fulfillment & cash, while managing through a challenging environment Taking action to drive growth and price and to take cost out On track to build a billion-dollar industry-leading company
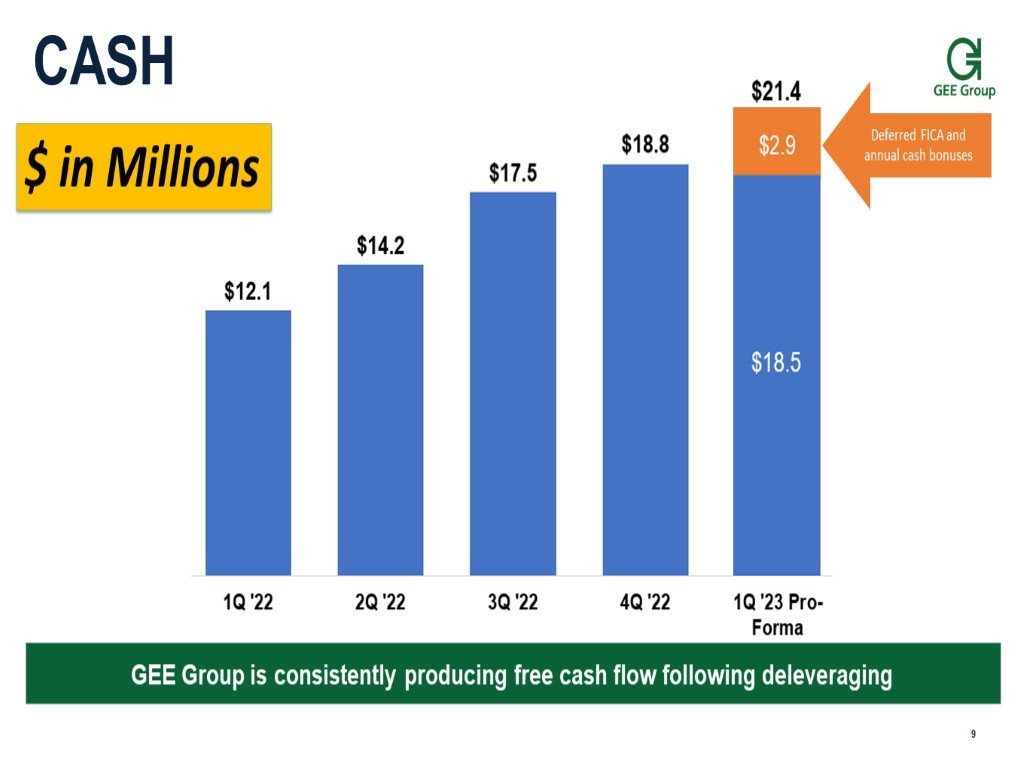
9 GEE Group is consistently producing free cash flow following deleveraging CASH $ in Millions $2.9 Deferred FICA and annual cash bonuses
10 Confidential 12. Additional Information to Consider and Use of Non-GAAP Financial Measures 13. GAAP to Non-GAAP reconciliations 14. Forward-looking statements 15. About GEE Group Inc. Supplemental Information
11 Use of Non-GAAP Financial Measures The Company discloses certain non-GAAP financial measures in this investor presentation, including Adjusted Net Income, EBITDA, Adjusted EBITDA and Free Cash Flow. Management and the board of directors use and refer to these non-GAAP financial measures internally as a supplement to GAAP financial information for purposes of evaluating operating performance, financial planning purposes, establishing operational and budgetary goals, compensation plans, analysis of debt service capacity, capital expenditure planning and determining working capital needs; and also believe that these are useful financial measures used by investors. Non-GAAP Adjusted Net Income is defined as Net Income adjusted for non-cash stock compensation expenses, acquisition, integration, restructuring and other non-recurring expenses, capital markets-related expenses, gains or losses on extinguishment of debt and noncash goodwill impairment charges. Non-GAAP EBITDA is defined as Net Income before interest, taxes, depreciation and amortization. Non-GAAP Adjusted EBITDA is defined as EBITDA, adjusted for the same items as Adjusted Net Income. Non-GAAP Free Cash Flow is defined as Cash Flow from Operating Activities, less capital expenditures. Non-GAAP Adjusted Net Income, EBITDA, Adjusted EBITDA and Free Cash Flow are not terms defined by GAAP and, as a result, the Company's measure of them might not be comparable to similarly titled measures used by other companies. Generally, a non-GAAP financial measure is a numerical measure of a company's performance, financial position, or cash flow that either excludes or includes amounts that are not normally excluded or included, as the case may be, in the most directly comparable measure calculated and presented in accordance with GAAP. The non-GAAP financial measures discussed above should be considered in addition to, and not as substitutes for, nor as being superior to Net Income reported in the Consolidated Statements of Income, cash and cash flows reported in the Consolidated Statements of Cash Flows, or other measures of financial performance, as reflected on the Company's consolidated financial statements prepared in accordance with U.S. GAAP included in Form 10-K and Form 10-Q for their respective periods filed with the SEC, which should be read and referred to in order to obtain a comprehensive and thorough understanding of the Company's financial results. The reconciliations of Net Income to non-GAAP Adjusted Net Income, Net Income to EBITDA and Adjusted EBITDA, and Cash Flows from Operating Activities to Free Cash Flows referred to in the highlights or elsewhere in this investor presentation are provided in the following schedules that also form a part of this investor presentation. Additional Information to Consider in Conjunction with the Investor Presentation The financial information and highlight information included herein should be read in conjunction with all of the financial and other information included in GEE Group's Annual Reports on Form 10-K, Quarterly Reports on Form 10-Q, Current Reports on Forms 8-K and 8-K/A, Registration Statements and Amendments on Forms S-1 and S-3, and Information Statements on Schedules 14A and 14C, filed with the SEC, the discussion of financial results in this investor presentation, and the information included herein regarding the use of non-GAAP financial measures and the related schedules attached hereto which reconcile the related items prescribed by accounting principles generally accepted in the United States (“GAAP”) to the non-GAAP financial information. These non-GAAP financial measures are not a substitute for the comparable measures prescribed by GAAP as further discussed below in this investor presentation. Financial information provided in this investor presentation may consist of or refer to estimates, projected or pro forma financial information and certain assumptions that are considered forward looking statements, are predictive in nature and depend on future events, and any such predicted or projected financial or other results may not be realized nor are they guarantees of future performance. See "Forward-Looking Statements" below which incorporates "Risk Factors" related to the COVID-19 pandemic and other potential items which may possibly have a negative effect on the Company's business.
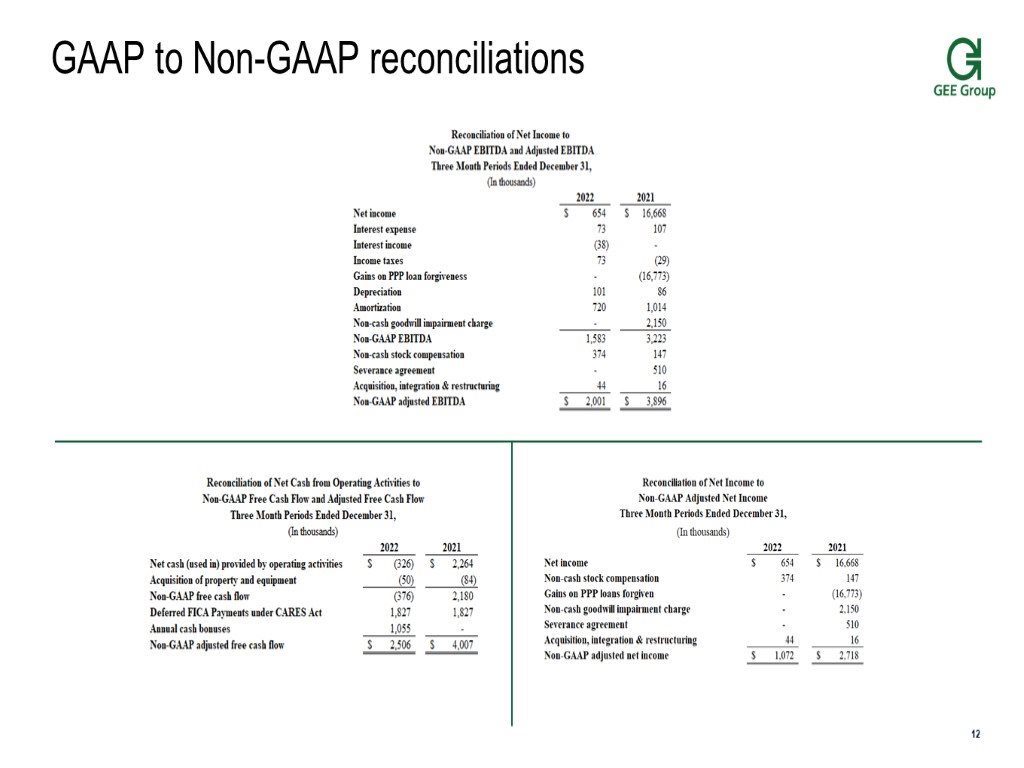
12 GAAP to Non-GAAP reconciliations
13 Forward-Looking Statements In addition to historical information, this investor presentation contains statements relating to possible future events and/or the Company's future results (including results of business operations, certain projections, future financial condition, pro forma financial information, and business trends and prospects) that are "forward-looking statements" within the meaning of Section 27A of the Securities Act of 1933, as amended, and Section 21E of the Securities Act of 1934, as amended, (the "Exchange Act"), and the Private Securities Litigation Reform Act of 1995 and are subject to the "safe harbor" created by those sections. The statements made in this investor presentation that are not historical facts are forward-looking statements that are predictive in nature and depend upon or refer to future events. Such forward-looking statements often contain, or are prefaced by, words such as "will", "may," "plans," "expects," "anticipates," "projects," "predicts," “pro forma”, "estimates," "aims," "believes," "hopes," "potential," "intends," "suggests," "appears," "seeks," or variations of such words or similar words and expressions. Forward-looking statements are not guarantees of future performance, are based on certain assumptions, and are subject to various known risks and uncertainties, many of which are beyond the Company's control, and cannot be predicted or quantified and, consequently, as a result of a number of factors, the Company's actual results could differ materially from those expressed or implied by such forward-looking statements. The international pandemic, the “Novel Coronavirus” (“COVID”-19), has been detrimental to and may continue to negatively impact and disrupt the Company’s business operations. The health outbreak has caused a significant negative effect on the global economy, employment in general including the lack of demand for the Company’s services which is exacerbated by government and client directed “quarantines”, “remote working”, “shut-downs” and “social distancing”. There is no assurance that conditions will not persist or worsen and further negatively impact GEE Group. Certain other factors that might cause the Company's actual results to differ materially from those in the forward-looking statements include, without limitation: (i) the loss, default or bankruptcy of one or more customers; (ii) changes in general, regional, national or international economic conditions; (iii) an act of war or terrorism, industrial accidents, or cyber security breach that disrupts business; (iv) changes in the law and regulations; (v) the effect of liabilities and other claims asserted against the Company including the failure to repay indebtedness or comply with lender covenants including the lack of liquidity to support business operations and the inability to refinance debt, failure to obtain necessary financing or the inability to access the capital markets and/or obtain alternative sources of capital; (vi) changes in the size and nature of the Company's competition; (vii) the loss of one or more key executives; (viii) increased credit risk from customers; (ix) the Company's failure to grow internally or by acquisition or the failure to successfully integrate acquisitions; (x) the Company's failure to improve operating margins and realize cost efficiencies and economies of scale; (xi) the Company's failure to attract, hire and retain quality recruiters, account managers and salesmen; (xii) the Company's failure to recruit qualified candidates to place at customers for contract or full-time hire; (xiii) the adverse impact of geopolitical events, government mandates, natural disasters or health crises, force majeure occurrences, global pandemics such as the deadly “coronavirus” (COVID-19) or other harmful viral or non-viral rapidly spreading diseases and such other factors as set forth under the heading "Forward-Looking Statements" in the Company's annual reports on Form 10-K, its quarterly reports on Form 10-Q and in the Company's other filings with the Securities and Exchange Commission (SEC). More detailed information about the Company and the risk factors that may affect the realization of forward-looking statements is set forth in the Company's filings with the SEC. Investors and security holders are urged to read these documents free of charge on the SEC's web site at http://www.sec.gov. The Company is under no obligation to (and expressly disclaims any such obligation to) and does not intend to publicly update, revise, or alter its forward-looking statements whether as a result of new information, future events or otherwise.
14 About GEE Group GEE Group Inc. is a provider of specialized staffing solutions and is the successor to employment offices doing business since 1893. The Company operates in two industry segments, providing professional staffing services and solutions in the information technology, engineering, finance and accounting specialties and commercial staffing services through the names of Access Data Consulting, Agile Resources, Ashley Ellis, General Employment, Omni-One, Paladin Consulting and Triad. Also, in the healthcare sector, GEE Group, through its Scribe Solutions brand, provides medical scribes who assist physicians in emergency departments of hospitals and in medical practices by providing required documentation for patient care in connection with electronic medical records (EMR). Additionally, the Company provides contract and direct hire professional staffing services through the following SNI brands: Accounting Now®, SNI Technology®, Legal Now®, SNI Financial®, Staffing Now®, SNI Energy®, and SNI Certes. Contact: GEE Group Inc. Kim Thorpe 904.512.7504 invest@geegroup.com SOURCE: GEE Group Inc.